
예측 라우팅 대기열 세부정보 보기
개별 대기열의 대기열 세부 정보 보기에는 선택한 대기열 성능의 다양한 측면이 표시됩니다. 이 페이지에는 다음 탭이 포함되어 있습니다.
- 개요 – 선택한 기간에 대한 예측 라우팅의 영향을 요약하는 대기열 세부 정보 보기를 엽니다. 개요 탭에 대한 자세한 내용은 이 페이지의 후속 섹션에서 확인할 수 있습니다.
- 예측 모델 – 선택한 대기열의 라우팅 결정에 기여하는 주요 기능을 제시합니다. 자세한 내용은 다음을 참조하십시오. 예측 라우팅 결정에 영향을 준 기능 보기.
대기열 세부정보 보다 선택한 기간에 대한 예측 라우팅의 영향에 대한 메트릭이 포함되어 있습니다.
작업공간에서 기본 시간대 설정
분석 보기를 보기 전에 분석 작업 영역에서 기본 시간대를 설정할 수 있습니다.
작업공간에서 기본 시간대를 설정하려면 다음 단계를 따르세요.
- 딸깍 하는 소리 성능 > 작업 공간.
- 딸깍 하는 소리 메뉴 > 분석 > 분석 작업 공간 .
- 왼쪽부터 시간대 드롭다운 메뉴에서 필요한 시간대를 분석 작업 영역의 기본 시간대로 선택합니다.
특정 대기열에 대한 세부 정보를 보려면 보다, 이동 성능 > 작업공간 > 컨택센터 > 예측 라우팅 을 클릭하고 목록에서 특정 대기열의 이름을 클릭합니다.
특정 대기열에 대한 세부 정보를 보려면 보기에서 다음을 수행합니다.
- 딸깍 하는 소리 메뉴 > 분석 > 분석 작업 공간 .
- 에서 기본 섹션에서 검색 예측 라우팅 그런 다음 뷰 이름을 클릭하여 엽니다.
- 특정 대기열의 이름을 클릭하세요.
자세한 내용은 다음을 참조하세요. 예측 라우팅 대기열 영향 보기 .
특정 대기열의 세부 정보 귀하가 선택한 KPI에 따라 달라집니다.
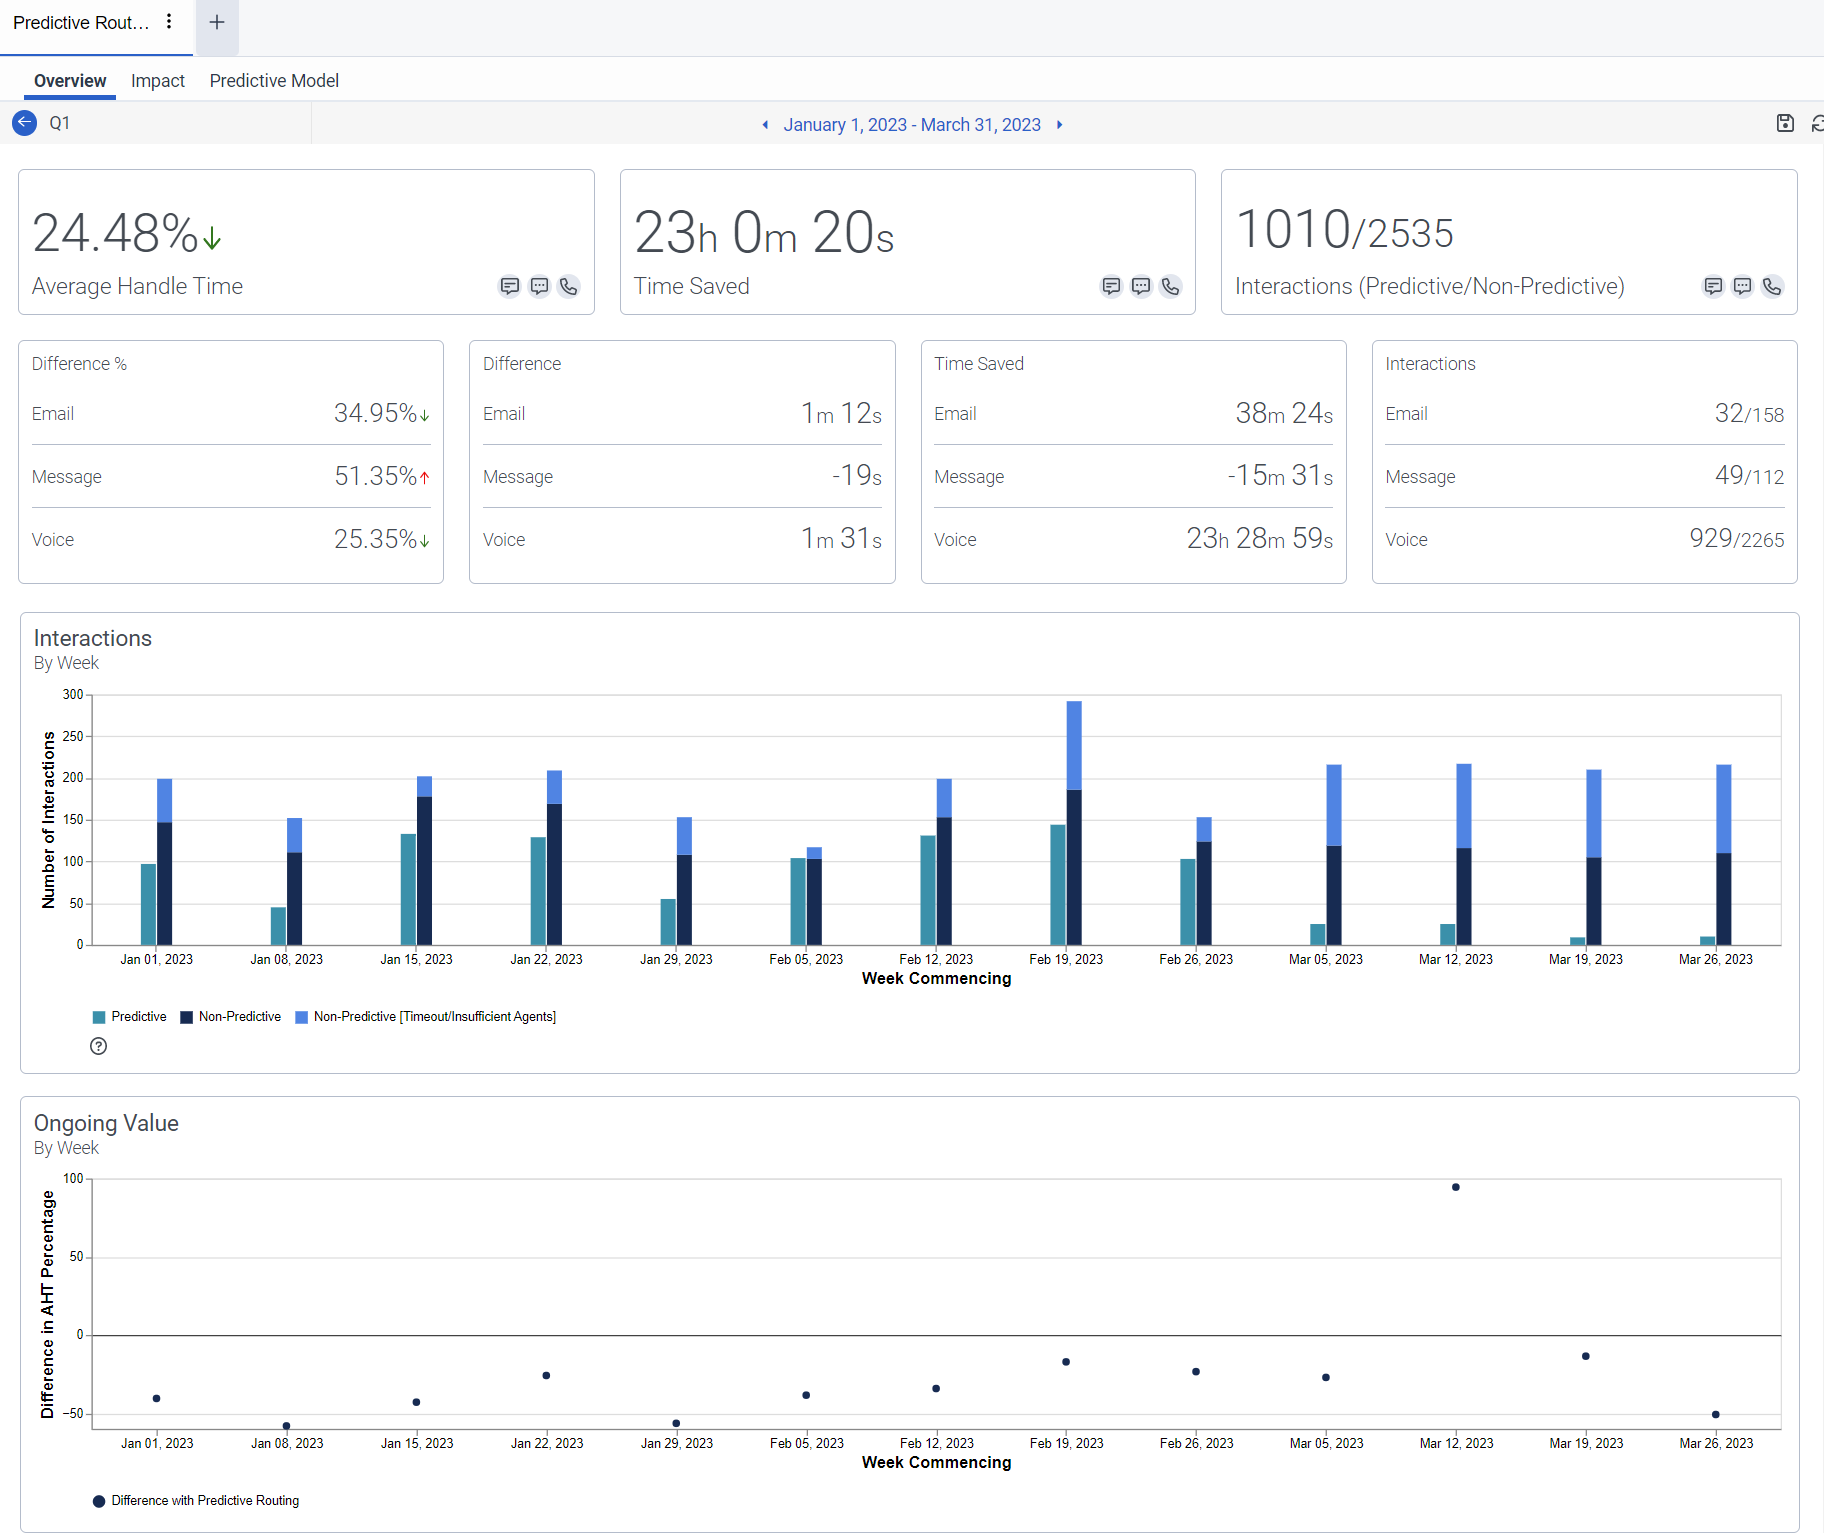
평균 처리 시간 KPI를 사용하여 다음 세부 정보를 표시합니다.
| 세부사항 | 설명 | 노트 (참고로 이미지를 참고하세요) |
|---|---|---|
|
평균 처리 시간(AHT 차이 %) |
선택한 기간 동안 예측 라우팅을 사용하여 라우팅된 상호작용의 처리 시간과 예측하지 않는 라우팅 방법을 사용하여 라우팅된 상호작용의 처리 시간의 백분율 차이를 나타냅니다. |
대기열이 두 개 이상의 미디어 유형을 지원하는 경우 AHT 차이 % 값 외에도 미디어 유형별 AHT 차이 %에 대한 세부 정보가 표시됩니다. AHT 차이 %는 각 미디어 유형 %의 합계 또는 평균과 일치하지 않습니다. |
| AHT 차이 |
상호작용 간 AHT 값의 차이를 나타냅니다. 저것 예측 라우팅과 상호 작용을 사용하여 라우팅됨 저것 선택된 날짜 범위 동안 상호 작용당 예측 라우팅 없이 라우팅됩니다. 이 값은 시, 분, 초로 나타납니다. |
AHT 차이 값은 특정(단일) 미디어 유형 대기열에 대해서만 표시됩니다. 대기열에 두 개 이상의 미디어 유형이 포함된 경우 미디어 유형별 AHT 차이에 대한 세부 정보가 표시됩니다. |
| 시간 절약 |
선택한 기간 동안 예측 라우팅을 사용할 때 절약된 처리 시간을 나타냅니다. 절약된 시간은 예측 라우팅을 사용하여 총 상호작용 수에 지정된 날짜 범위에 대한 AHT 차이를 곱하여 계산됩니다. |
대기열이 두 개 이상의 미디어 유형을 지원하는 경우 미디어 유형에 따른 데이터 세부 정보가 절약된 시간 표 아래에 표시됩니다. |
| 인터랙션 |
총 상호작용 수를 나타냅니다. 저것 예측 라우팅으로 라우팅됨 다른 라우팅 방법이 처리하는 수와 비교 . 예를 들어, 아래의 단일 미디어 대기열 이미지에서 1010은 총 상호 작용 수입니다. 라우팅된 예측 라우팅을 사용한 상호작용의 총 수는 2535이고, 예측 라우팅을 사용하지 않고 처리한 상호작용의 총 수는 2535입니다. |
대기열이 두 개 이상의 미디어 유형을 지원하는 경우 미디어 유형에 따른 데이터 분석도 표시됩니다. 모든 미디어 유형의 상호 작용 수가 0이면 총 상호 작용 수가 다릅니다. 0 값은 총 상호 작용 수에 고려되지 않기 때문입니다. . |
| 상호작용 막대 차트 |
선택한 날짜 범위에 대한 예측 라우팅 및 비예측 라우팅 볼륨을 주 단위로 표시합니다. Genesys Cloud가 예측 라우팅 시간이 초과되기 전에 적격 에이전트를 찾지 못하거나 대기열에 있는 에이전트 수가 3명 이하인 경우 상호작용 라우팅은 다음을 통해 이루어집니다. 표준 라우팅 이는 폴백 라우팅 방법입니다. 에이전트 선택 프로세스에 대한 자세한 내용은 다음을 참조하세요. 에이전트 선정 과정 . |
차트에 표시된 첫 번째 주는 선택한 날짜 범위의 첫 번째 날부터 시작됩니다. 마지막 주는 선택한 날짜 범위에 따라 전체 또는 부분 주입니다. 비예측(시간 초과/상담원 부족) 막대는 Genesys Cloud가 예측 라우팅을 시도했지만 대신 비예측 라우팅 방법을 사용한 모든 상호작용을 나타냅니다. |
| 진행 중인 값(AHT 차이 % 산점도) |
이 산점도는 0선 위 또는 아래의 주간 AHT 차이 % 값을 나타냅니다. 0선의 점은 예측 라우팅이 비예측 상호작용과 비교하여 예측 상호작용의 AHT에서 차이를 만들지 않았음을 나타냅니다. 0선 위의 양수 값은 예측 라우팅을 사용하여 라우팅된 상호작용의 평균 처리 시간이 예측 라우팅 없이 라우팅된 상호작용의 처리 시간보다 길다는 것을 나타냅니다. 0선 아래의 값은 예측 라우팅을 사용하여 라우팅된 상호 작용이 예측 라우팅 없이 라우팅된 상호 작용보다 처리 시간이 더 짧음을 나타냅니다. 특정 날짜의 데이터를 보려면 그래프의 지점 중 하나 위로 마우스를 가져갑니다. |
차트에 표시된 첫 번째 주는 선택한 날짜 범위의 첫 번째 날부터 시작됩니다. 마지막 주는 선택한 날짜 범위에 따라 전체 또는 부분 주입니다. |
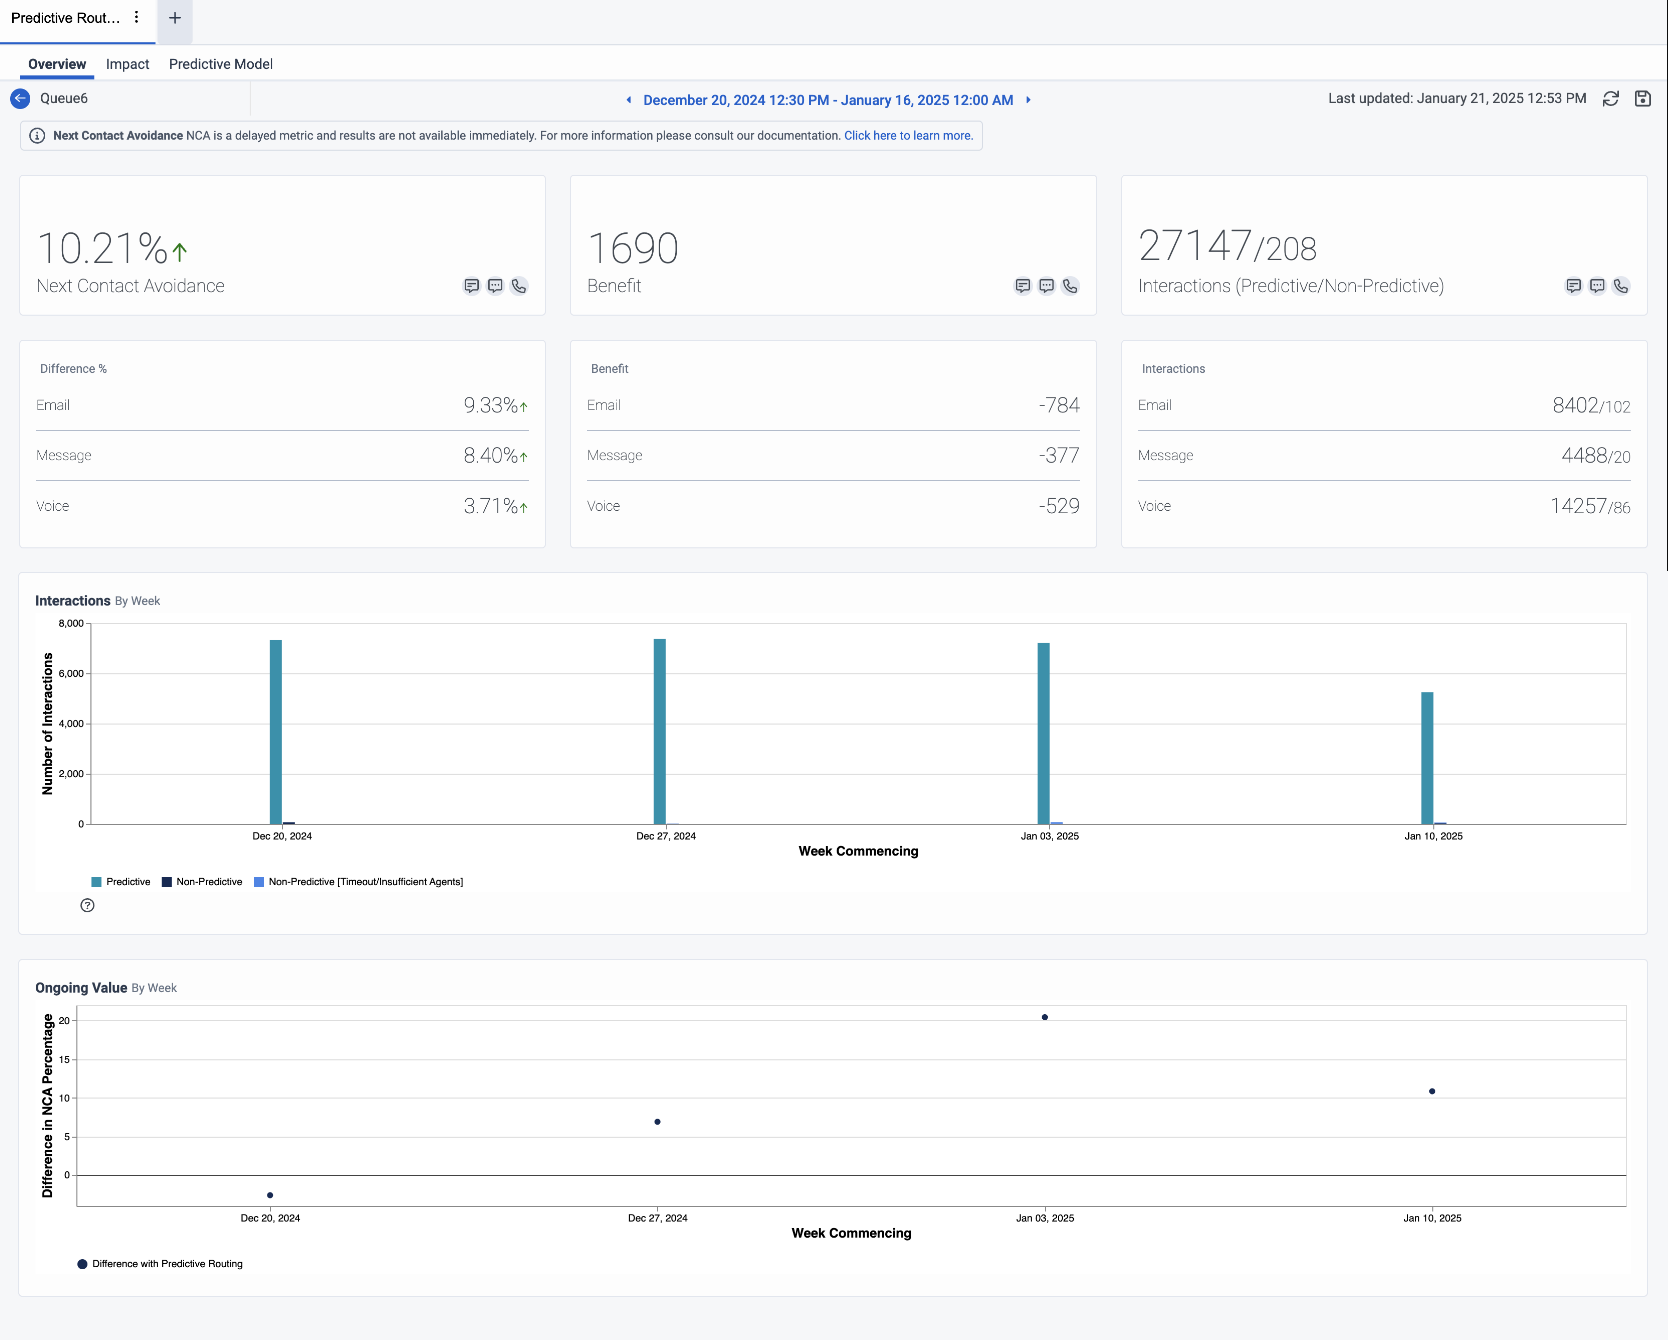
다음 연락처 회피 KPI를 사용하여 다음 세부 정보를 표시합니다.
| 세부사항 | 설명 | 노트 (참고로 이미지를 참고하세요) |
|---|---|---|
|
다음 접촉 회피(NCA 차이 %) |
선택한 기간 동안 예측 라우팅을 사용하여 라우팅된 반복 접촉 회피 상호작용 수와 예측하지 않는 라우팅 방법을 사용하여 라우팅된 반복 접촉 회피 상호작용 수의 백분율 차이를 나타냅니다. |
대기열이 두 개 이상의 미디어 유형을 지원하는 경우 NCA 차이 % 값 외에도 미디어 유형별 NCA 차이 %에 대한 세부 정보가 표시됩니다. NCA 차이 %는 각 미디어 유형의 % 합계 또는 평균과 일치하지 않습니다. |
| 혜택 |
선택한 기간 동안 예측 라우팅을 사용할 때 반복되는 접촉을 피한 상호 작용의 수를 나타냅니다. 혜택은 반복 접촉을 피한 횟수를 기준으로 계산됩니다. |
대기열이 두 개 이상의 미디어 유형을 지원하는 경우 미디어 유형에 따른 데이터 세부 정보도 이점 표 아래에 표시됩니다. |
| 인터랙션 |
예측 라우팅을 통해 라우팅된 상호작용의 총 수를 다른 라우팅 방법을 통해 처리된 상호작용 수와 비교하여 나타냅니다. 예를 들어, 아래의 단일 미디어 대기열 이미지에서 27,147은 예측 라우팅으로 라우팅된 총 상호 작용 수이고, 208은 예측 라우팅 없이 처리된 총 상호 작용 수입니다. |
대기열이 두 개 이상의 미디어 유형을 지원하는 경우 미디어 유형에 따른 데이터 분석도 표시됩니다. 모든 미디어 유형의 상호작용 수가 0이면 총 상호작용 수가 달라집니다. Genesys Cloud는 총 상호작용 수에 0값을 고려하지 않기 때문입니다. |
| 상호작용 막대 차트 |
선택한 날짜 범위에 대한 예측 라우팅 및 비예측 라우팅 볼륨을 주 단위로 표시합니다. Genesys Cloud가 예측 라우팅 시간이 초과되기 전에 적격 에이전트를 찾지 못하거나 대기열에 있는 에이전트 수가 3명 이하인 경우 상호작용 라우팅은 다음을 통해 이루어집니다. 표준 라우팅 이는 폴백 라우팅 방법입니다. 에이전트 선택 프로세스에 대한 자세한 내용은 다음을 참조하세요. 에이전트 선정 과정 . |
차트에 표시된 첫 번째 주는 선택한 날짜 범위의 첫 번째 날부터 시작됩니다. 마지막 주는 선택한 날짜 범위에 따라 전체 또는 부분 주입니다. 비예측(시간 초과/상담원 부족) 막대는 Genesys Cloud가 예측 라우팅을 시도했지만 대신 비예측 라우팅 방법을 사용한 모든 상호작용을 나타냅니다. |
| 진행 중인 가치(NCA 차이 % 산점도) |
이 산점도는 0선을 기준으로 위 또는 아래의 주별 NCA 차이 % 값을 나타냅니다. 0선의 점은 예측 라우팅이 예측 상호작용의 NCA와 비예측 상호작용의 NCA에 차이를 만들지 않았음을 나타냅니다. 0선 위의 양수 값은 예측 라우팅 성능이 향상되었음을 나타냅니다. 0선 아래의 음수 값은 예측 라우팅이 다른 라우팅 방법보다 더 나은 결과를 제공하지 못한다는 것을 나타냅니다. 특정 날짜의 데이터를 보려면 그래프의 지점 중 하나 위로 마우스를 가져갑니다. |
차트에 표시된 첫 번째 주는 선택한 날짜 범위의 첫 번째 날부터 시작됩니다. 마지막 주는 선택한 날짜 범위에 따라 전체 또는 부분 주입니다. |
- 기간을 변경하려면 상단의 날짜를 클릭하세요. 보다 다른 날짜를 선택하세요.
- 예측 라우팅 목록으로 돌아가려면 대기열 옆에 있는 다음 뒤로 아이콘을 클릭하세요. 보다 이름
 .
.